The shopping journey is a graph: Bayesian attribution you can defend in a budget meeting
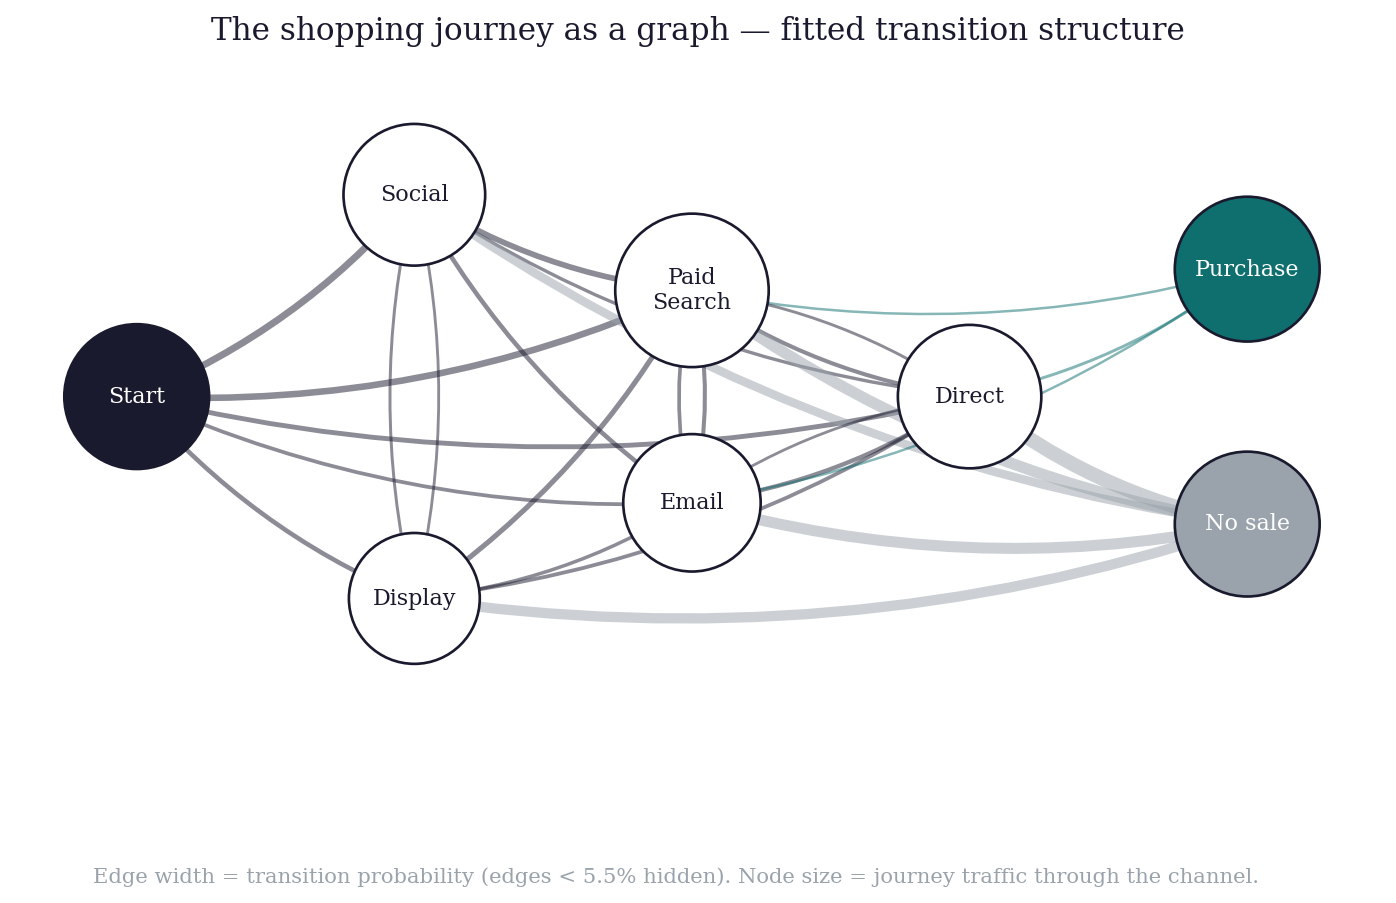
The fitted journey graph. Edge width is transition probability; node size is journey traffic.
Every attribution model answers the same question: which touchpoints deserve credit for a sale? And nearly every model running in production answers it with a point estimate -- one number per channel, delivered with more confidence than the data supports.
I have sat in enough budget meetings to know what happens next. Paid search shows 34% of conversions, social shows 7%, and next quarter's budget moves accordingly. Nobody asks how certain those numbers are, because the model never said. I have watched real money move on that silence.
This post builds the attribution framework I think more measurement teams should be running: model the journey as the graph it actually is, and carry uncertainty all the way through to the decision. I built the full pipeline on synthetic data, the model consumes only aggregated counts -- no user-level records survive the first step -- and every number below comes from code you can run yourself.
The journey as a graph, not a sequence
Our industry spent a decade debating credit heuristics. First touch, last touch, linear, U-shaped, time decay. All of them are arbitrary. They allocate credit by convention, and the convention you pick determines the answer you get. That is not measurement.
The graph framing asks a better question. Model each channel as a node and each observed hand-off as a weighted edge -- the probability that a shopper seen at channel A shows up next at channel B, converts, or leaves. Two absorbing states close the graph: Purchase and No sale.
This is a first-order Markov chain. It earns its place not because shoppers are Markovian -- they are not, quite -- but because it turns attribution into a question with a principled answer: how much would total conversion drop if this channel did not exist? Delete a node, redirect its traffic to No sale, recompute the graph's conversion rate, and compare. That is the removal effect. Unlike credit-splitting rules, it is a counterfactual computed from the journey structure itself.
For this build I simulated 25,000 shopper journeys across five channels -- social, display, paid search, email, and direct -- from a known ground-truth process, then fit the model to the simulated observations. Synthetic data is a deliberate choice, not a compromise. It lets me publish every number, and it lets me check the model against a truth I control. The fitted journeys convert at 8.8%, with a typical path of one to three touches.
Privacy by construction, not by policy
Here is the part of this architecture I care most about, and the part most attribution write-ups skip.
After ingestion, the model never touches user-level data. Everything downstream -- estimation, attribution, uncertainty -- consumes one artifact: an 8×8 matrix of transition counts. How many journeys went from social to email. How many went from search to purchase. No user IDs, no timestamps, no device graphs, no paths tied to a person.
          Social  Display  Search  Email  Direct   Conv    Null
Start       6984     4046    6533   3029    4408      0       0
Social       563      755    2006   1466     929    150    3331
Search       503      671    1273   1503    1757    758    6411
Email        405      330    1091    636    1203    455    3904
...
That is the entire input. In production, these counts accumulate in a streaming aggregation with identifiers dropped at the edge, and the aggregate can take differential-privacy noise before it lands in an analytics store. Identifier-based tracking has been eroding for years, and regulators are not going to reverse the trend. Attribution methods that only ever needed aggregates will age well. Methods built on replaying user-level paths will not.
The Bayesian layer: a posterior over journey graphs
A count matrix gives you a point estimate of each edge -- divide each row by its sum. Most Markov attribution implementations stop there. The problem: a point estimate from 25,000 journeys and a point estimate from 2,000 journeys look identical in a slide deck. One of them should not be trusted, and the deck will not tell you which.
The fix is standard conjugate machinery, and it costs almost nothing. Each row of the transition matrix is a multinomial. The Dirichlet is its conjugate prior. Put a flat Dirichlet on each row, observe the counts, and the posterior is Dirichlet(prior + counts) -- exact, no MCMC. Sampling a plausible journey graph from the posterior is three lines:
def sample_graph(counts, alpha=1.0):
    T = np.zeros_like(counts, dtype=float)
    for i in transient_states:
        T[i] = rng.dirichlet(counts[i] + alpha)
    return T
Instead of one journey graph, we now have a distribution over journey graphs -- every graph consistent with the observed data, weighted by how consistent it is. Each sampled graph implies its own conversion rate and its own removal effect for every channel, computed exactly with a small linear solve over the absorbing chain:
def p_conversion(T, removed=None):
    if removed is not None:              # channel's inflow -> No sale
        T[:, NULL] += T[:, removed]
        T[:, removed] = 0.0
    Q = T[np.ix_(transient, transient)]  # transient -> transient
    R = T[np.ix_(transient, absorbing)]  # transient -> {Conv, Null}
    return np.linalg.solve(np.eye(len(transient)) - Q, R)[START, CONV]
Run 4,000 posterior draws and every attribution number becomes a distribution. Point estimates become medians. Confidence becomes a credible interval you can print next to the number. And the question leadership actually asks -- are we sure search beats direct? -- becomes a probability you can compute instead of a judgment call you have to defend.
What the graph revealed that last-touch hid
| Channel | Last-touch | Journey graph (median) | 94% credible interval |
|---|---|---|---|
| Social | 6.8% | 16.8% | [16.2%, 17.4%] |
| Display | 2.4% | 9.5% | [9.2%, 9.9%] |
| Paid Search | 34.5% | 29.7% | [28.7%, 30.6%] |
| 20.7% | 19.0% | [18.1%, 19.8%] | |
| Direct | 35.5% | 25.0% | [24.0%, 26.1%] |
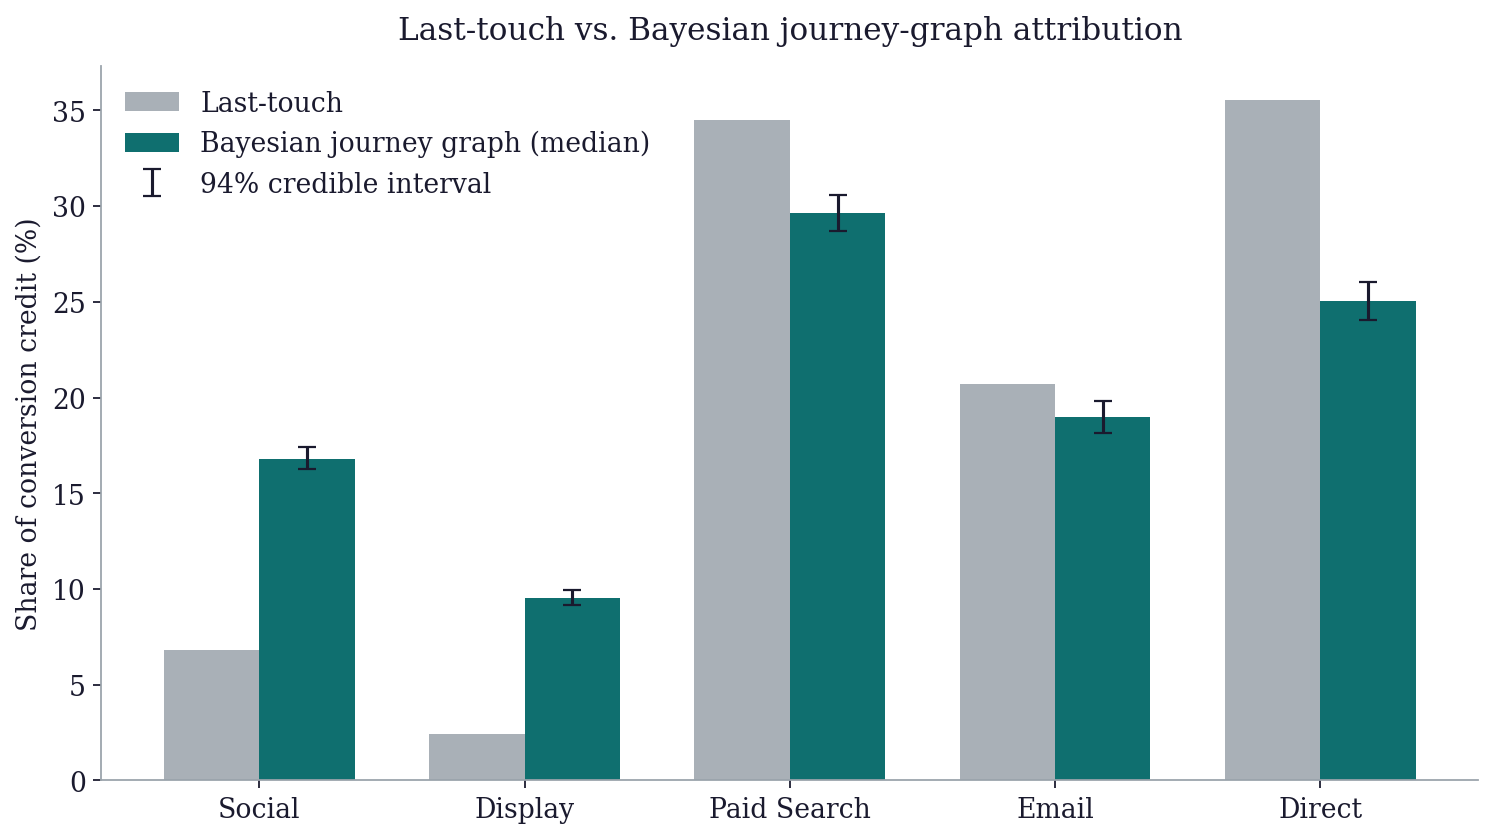
Last-touch vs. journey-graph credit, with 94% credible intervals.
Last-touch undervalued social by a factor of 2.5 and display by a factor of 4. Both do their work early in the journey and hand shoppers to the channels that close. Direct -- the classic last-touch winner, because it is where people show up after they have already decided -- gave back more than 10 points of credit. In conversion terms: last-touch handed social 150 conversions; the journey graph credits it with roughly 369.
Last-touch does not measure which channels create demand. It measures which channels are standing nearest the register when demand shows up.
The credible intervals turn ranking questions into probability statements. Across 4,000 posterior draws, paid search out-credits direct in every single sample. That ordering is safe to act on, and I can say so precisely:
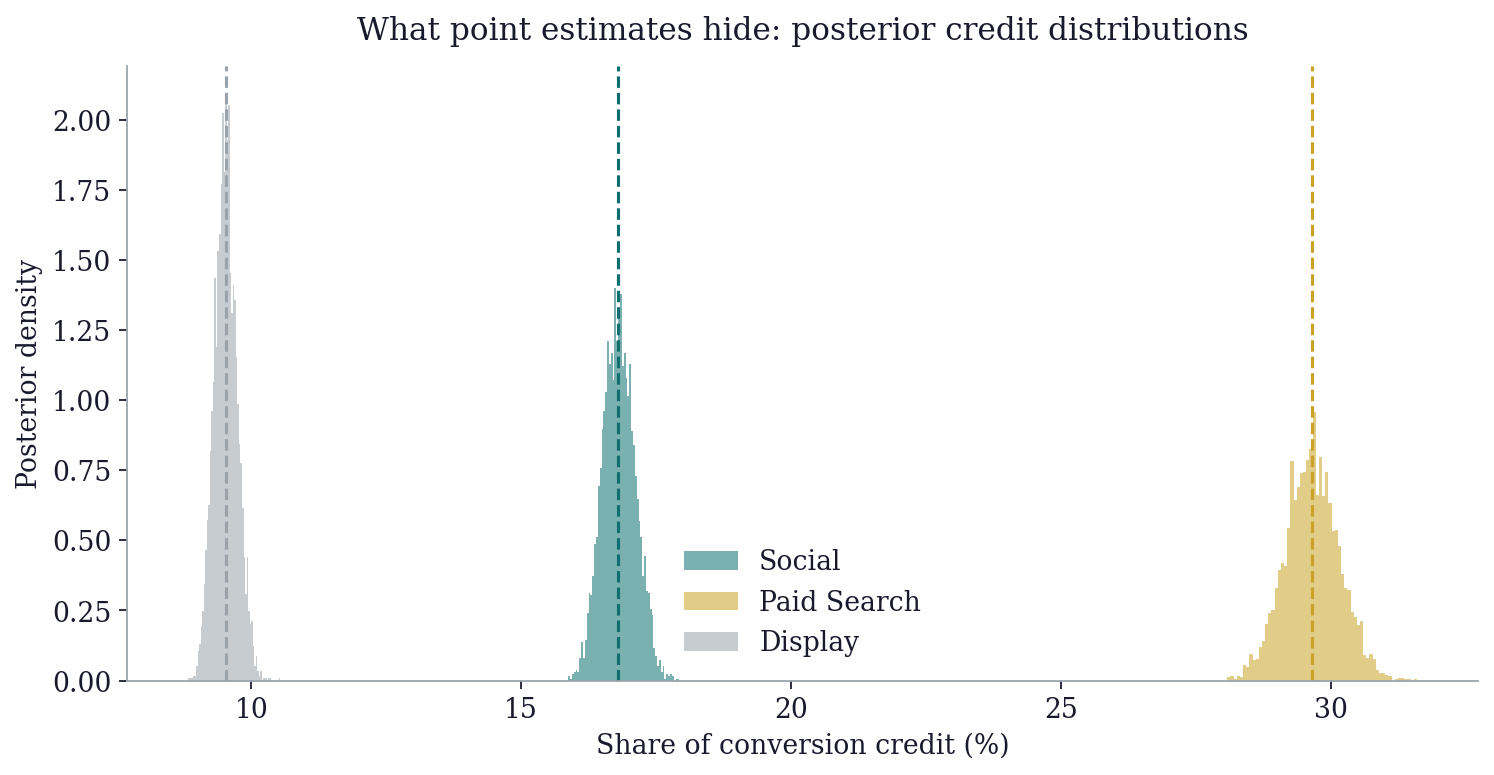
Full posterior distributions of conversion credit for three channels.
The part that changes decisions: knowing when not to act
Here is the same model fit two ways: once on the first 2,000 journeys -- roughly two weeks of data at this volume -- and once on the full 25,000.
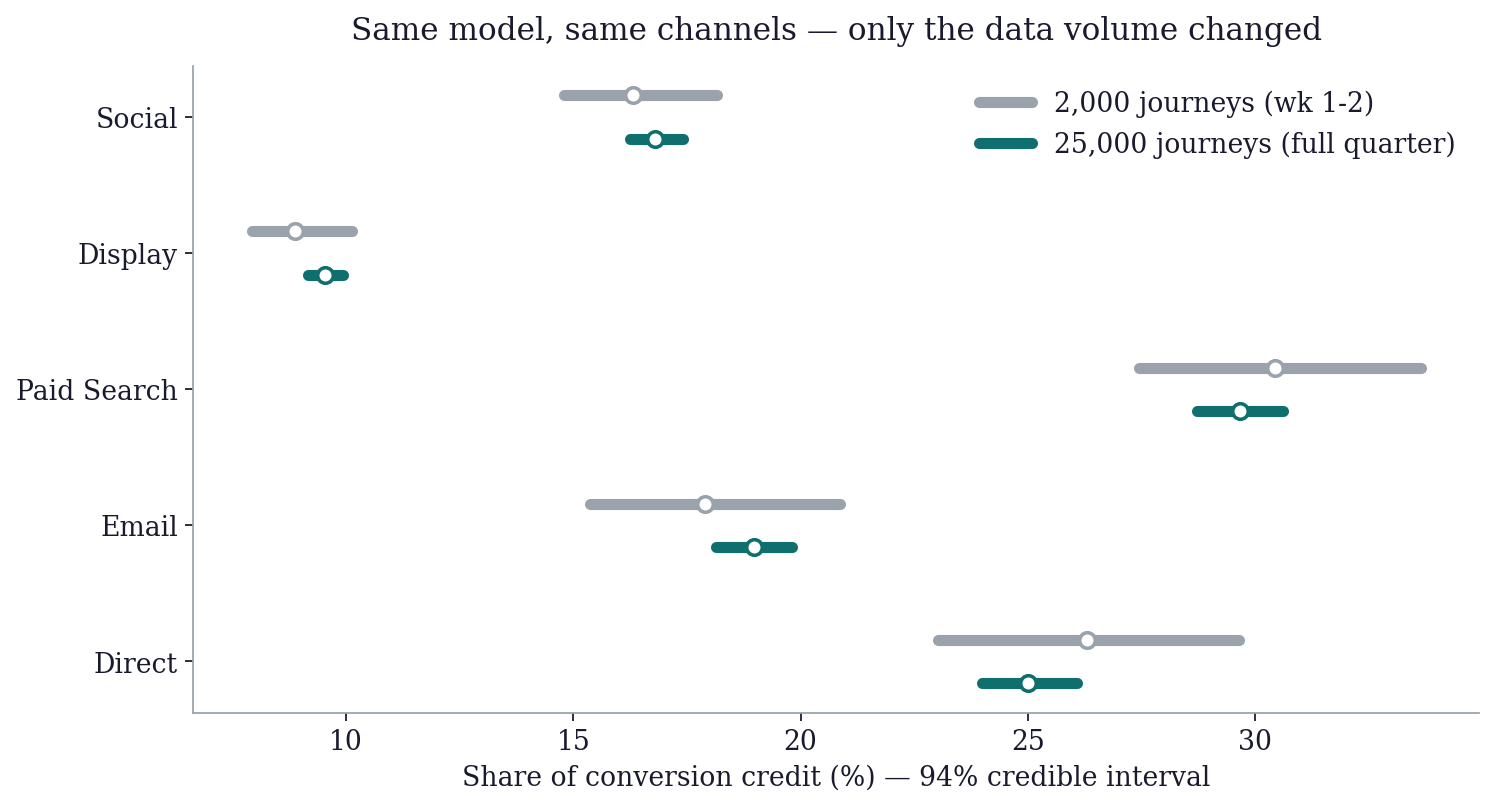
Same model, same channels -- only the data volume changed.
At 2,000 journeys, paid search sits at 30.4% [27.5, 33.6] and direct at 26.3% [23.0, 29.6]. The intervals overlap. A point-estimate model reports "search beats direct" with the same confidence at week two as at quarter end. I have seen budgets shift on week-two numbers. That is a bet on noise, and the team making it usually does not know it is betting.
The Bayesian layer says, precisely: the ordering is not resolved yet -- wait. At the full sample, the intervals separate cleanly and the reallocation case is defensible.
An attribution model has two jobs. Split the credit, and tell you when you have enough data to act on the split. Most models only do the first.
This is the practical argument for carrying uncertainty through the system. Not statistical hygiene -- decision quality, per decision, instead of a blanket rule of thumb about how long to wait.
What I would change before running this on real data
Attribution punishes overclaiming, so here is where this simplifies:
First-order memory is a simplification. Real shoppers carry more history than their last touch. Higher-order chains capture more structure at the cost of thinner counts per state -- which is exactly where the Dirichlet machinery helps, because the posterior widens honestly as states fragment.
Removal effects are observational, not experimental. The "delete a channel" counterfactual is computed from the observed graph, and it inherits whatever confounding lives there -- seasonality, audience overlap, correlated exposure. The rule I give my teams: graph attribution is the allocation layer; incrementality experiments -- geo holdouts, ghost bidding -- are the calibration layer. When the two disagree, the experiment wins.
Time matters. These journeys are sequences without clocks. Recency decay on edge weights, or modeling inter-touch durations, changes credit in ways that matter most for channels with long lags -- display especially.
None of these caveats break the framework. They are all extensions of the same graph, and the Bayesian treatment extends with them.
Closing thought
We spent a decade arguing about which credit heuristic is fairest. That was the wrong argument. Credit allocation is a modeling problem, journeys are graphs, and uncertainty is not a footnote -- it is the difference between a number you can present and a number you can defend.
The full implementation -- data generation, posterior sampling, attribution, every figure in this post -- is about 200 lines of Python with nothing beyond NumPy, pandas, and matplotlib. Code and reproducible outputs: github.com/reshshah/data-science-portfolio → attribution/.
Part 2 runs this framework on 1.76 million real shopping sessions -- and attributes purchases to site features instead of channels: Your site's features deserve attribution too →
All data in this post is synthetic, generated from a specified ground-truth process. No employer data, customer data, or proprietary information was used. Views are my own.
More articles