Your site's features deserve attribution too: what 1.76M real shopping sessions revealed
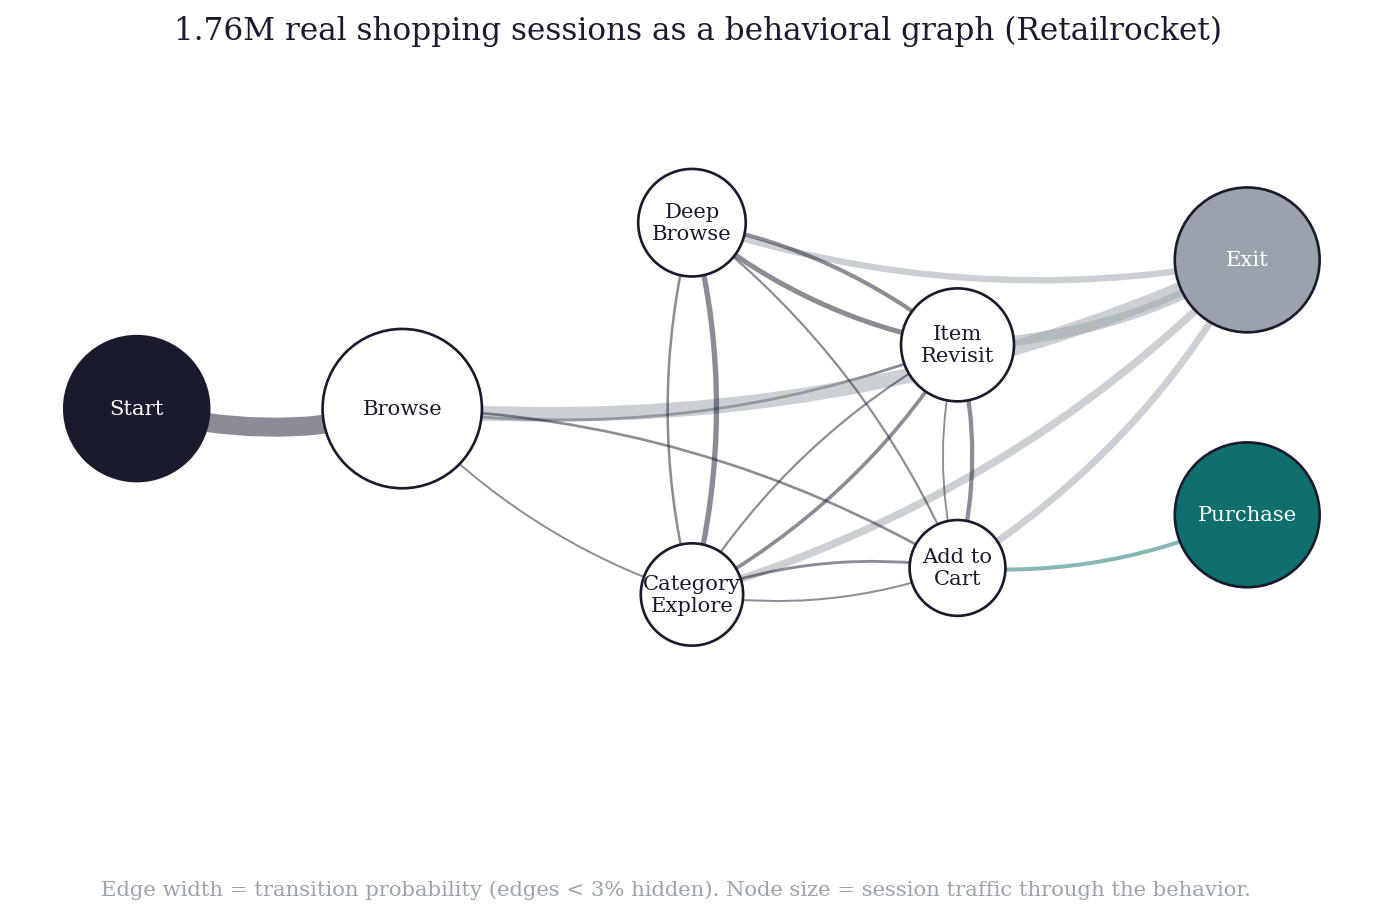
The fitted behavioral graph. Edge width is transition probability; node size is session traffic.
In Part 1 I built journey-graph attribution on synthetic data: model the path to purchase as a Markov graph, attribute conversions with removal effects, and carry Bayesian uncertainty through to the decision. Synthetic data was the right choice for introducing the method -- every number was checkable against a known truth.
This time the data is real: 2.76 million clickstream events from the public Retailrocket e-commerce dataset. And the question is different. Marketing teams argue about channel credit constantly. Almost nobody asks the same question about the site itself: which on-site behaviors do purchases actually depend on? Search, browsing depth, category exploration, returning to an item, adding to cart -- these are features product teams invest in, and most companies have no attribution model for them at all.
The method transfers directly. Swap channel nodes for behavior nodes, and the same graph answers a product question instead of a media question.
From channels to behaviors
I sessionized the raw events with a 30-minute inactivity rule -- 1.76 million sessions from 1.4 million visitors -- and mapped every event to a behavioral state: Browse (the first product views of a session), Deep Browse (a third or later view), Category Explore (a view that crosses into a new category), Item Revisit (returning to an item already viewed this session), and Add to Cart. Purchase and Exit close the graph as absorbing states.
State definitions are modeling decisions, and I want to be direct about that: different definitions produce different graphs. The rule I follow is to define states a product team could act on. "Deep Browse" maps to merchandising and page depth. "Item Revisit" maps to recently-viewed carousels and wishlists. A state you cannot act on is a state you should not model.
Sessions convert at 0.81% -- real e-commerce, not a synthetic convenience. The typical session is short: one to two behavioral transitions.
The privacy layer, now with formal teeth
Part 1 argued that attribution should consume only aggregate transition counts. On real data I went further, because "we aggregate" is a policy, and policies erode. Formal guarantees do not.
Two mechanisms sit between the raw events and the model. First, k-anonymity: any transition observed fewer than 50 times is suppressed. Second, differential privacy: Laplace noise on every cell of the count matrix, calibrated at the session level -- sessions are truncated at 20 transitions, so one shopper's session changes any count by at most 20, and noise is scaled accordingly. After this step, the model cannot tell whether any individual session was in the data at all.
The natural worry is that noise destroys the answers. So I measured it -- the same attribution run across privacy budgets from ε = 5 down to an aggressive ε = 0.05:
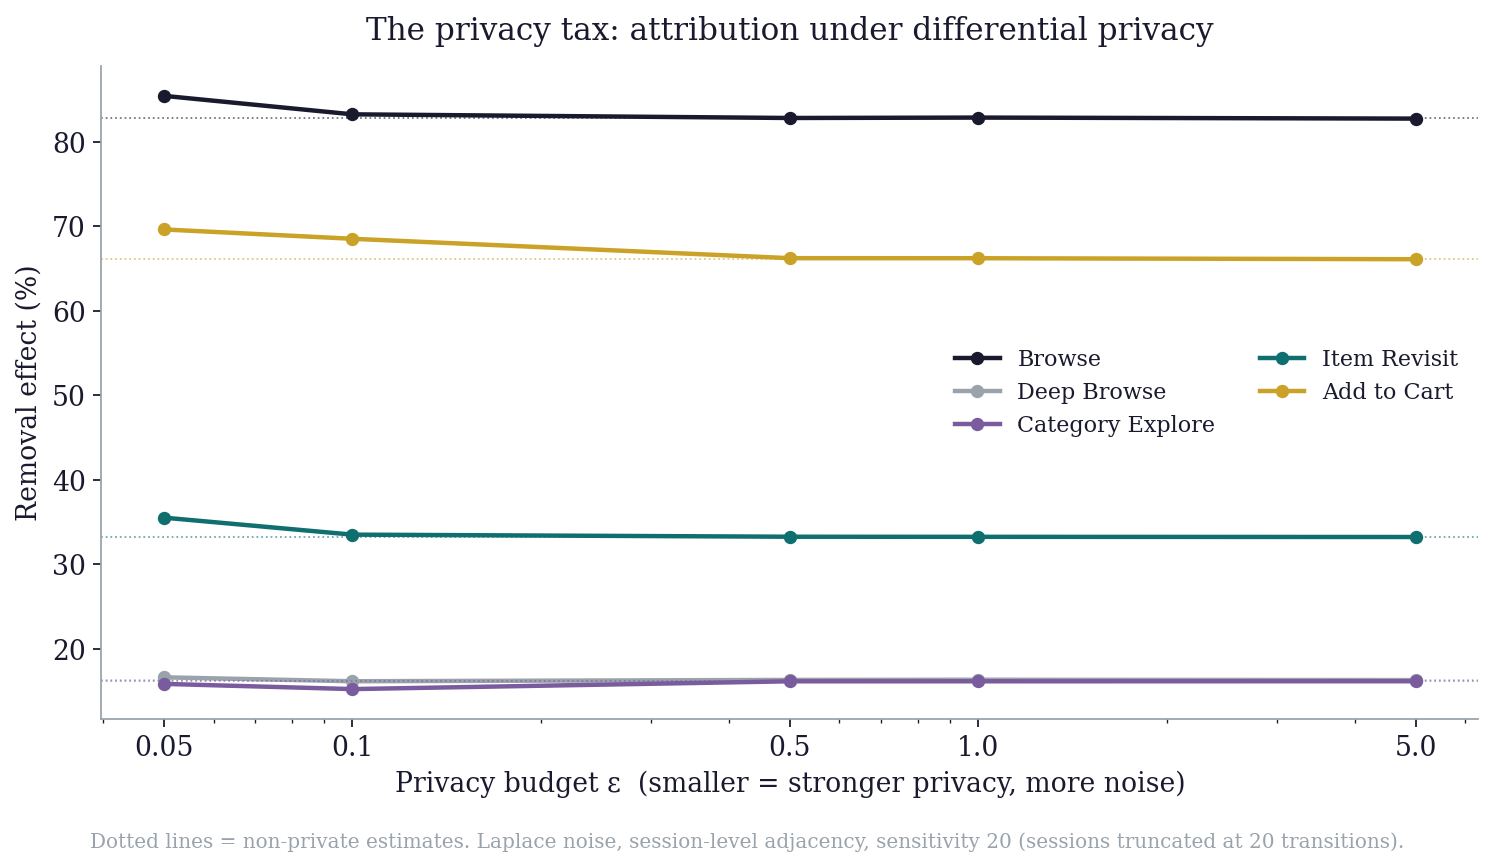
Removal effects across privacy budgets. Dotted lines are the non-private estimates.
The removal effects are unchanged down to ε = 0.5 and move two to three points at ε = 0.05. At this scale, formal privacy is essentially free.
Teams assume privacy and measurement trade off. At aggregate scale, the privacy tax on this analysis rounds to zero.
The reason is arithmetic, not magic: the smallest count that matters here is in the hundreds, and most are in the thousands. Laplace noise with scale 20/ε disappears into numbers that size. Privacy gets expensive at small counts -- which is exactly where k-anonymity suppression was already protecting individuals.
What purchases actually depend on
The removal effect asks: if this behavior did not exist, what share of purchases would be lost?
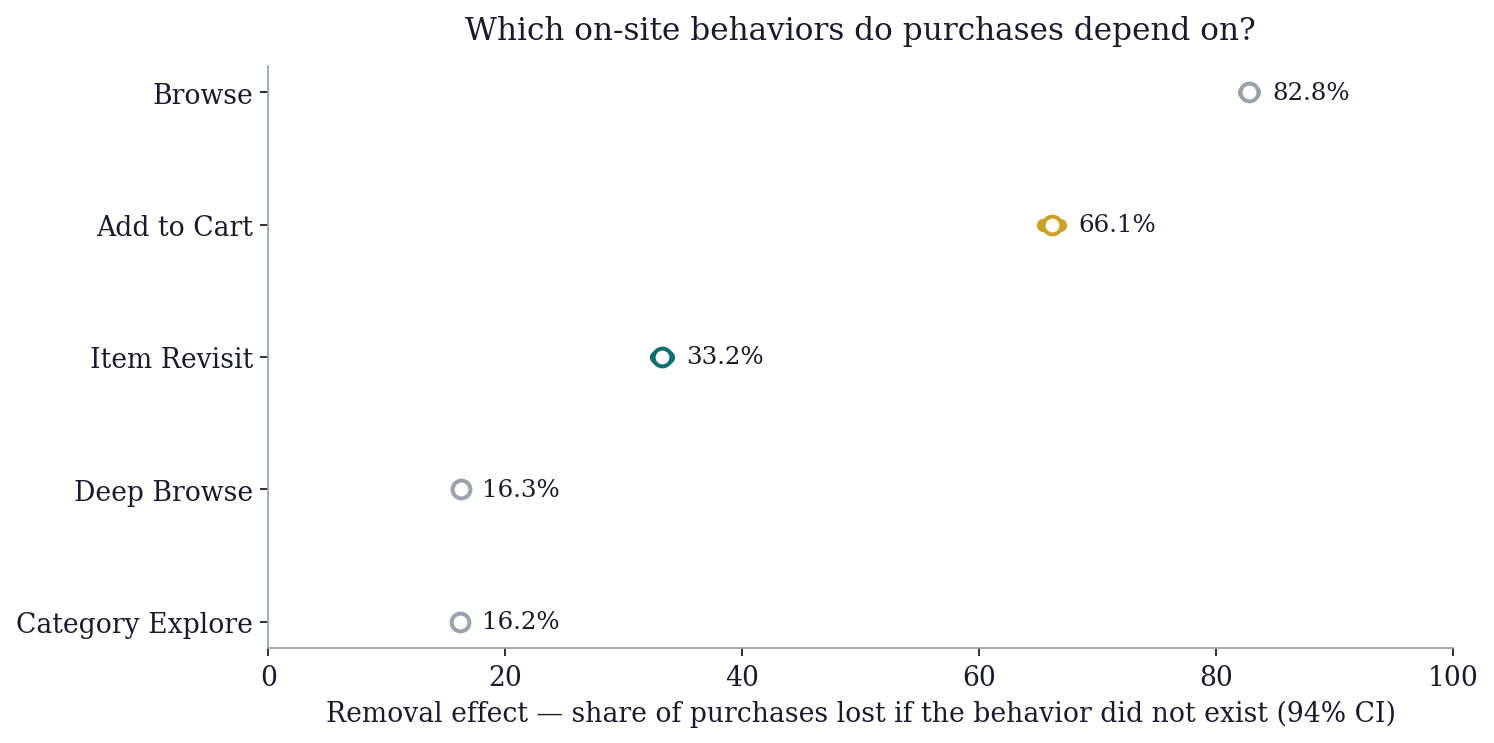
Share of purchases lost if each behavior did not exist, with 94% credible intervals.
Browse at 82.8% is the artery -- no surprise, nearly every journey starts there. Add to Cart at 66.1% is structural. The finding that changes decisions is the middle of the table:
A third of purchases depend on Item Revisit -- 33.2% [32.7, 33.7]. Coming back to an item already viewed carries twice the purchase load of deep browsing (16.3%) or category exploration (16.2%). Shoppers do not buy because they browsed more. They buy because they came back.
The product translation is concrete. Recently-viewed carousels, wishlists, saved items, price-drop nudges -- these support the single most purchase-critical discretionary behavior on the site. In my experience these features are chronically underinvested precisely because nobody attributes conversions to them; they are "nice to have" in roadmap debates while paid search gets a dedicated team. This graph gives the revisit path a number, and the number is large.
And one ordering stayed unresolved. Deep Browse versus Category Explore: 16.3% against 16.2%, with P(Deep Browse > Category Explore) = 0.73. Even at 1.76 million sessions, the model says that ranking is not decision-grade. This is Part 1's lesson repeating on real data -- the honest answer to "which matters more?" is sometimes "the data cannot say yet," and a model that can say so is worth more than one that cannot.
An honest caveat about the data
About a third of recorded purchases in this dataset have no preceding add-to-cart event -- 5,039 of 14,297 purchases enter the graph from other states. That is a tracking gap in the source data, not a real shopper behavior; treat the Add-to-Cart removal effect as a lower bound. Real clickstream is messy, and pretending otherwise is how attribution models lose credibility. The reconciliation is in the published transition counts, so you can check it yourself.
The other limitations carry over from Part 1: first-order memory, no clocks on the edges, and removal effects are observational -- the calibration layer is still experimentation. If the revisit finding were driving a real roadmap decision, the next step is not more modeling. It is an A/B test on the features that support revisiting.
Closing thought
Attribution is not a marketing problem. It is a decision problem, and it applies anywhere a company invests in steps along a journey -- media channels, site features, app surfaces, service touchpoints. The same fifty lines of Bayesian machinery answered a media question in Part 1 and a product question here, on real data, under a formal privacy guarantee, for the cost of a Kaggle download.
Code, counts, and every figure: github.com/reshshah/data-science-portfolio → attribution/feature-attribution.
This analysis uses the public Retailrocket dataset (Kaggle), which contains anonymized behavioral events. All published outputs are aggregate statistics protected by k-anonymity and differential privacy. No employer data or proprietary information was used. Views are my own.